QtiPlot - Data Analysis and Scientific Visualisation |
Try for free |
| Home | Download | Contact |
Project File (.qti)
QtiPlot is a dynamic tool: plots created from data sets and the tables and matrices owning that data are interconnected. When a data table is modified, all objects in dependent plot windows (curves, axes scales, legends) are automatically updated. All settings for a complete set of tables, matrices, plot windows and notes can be saved as a single project file (.qti). Projects are organised in subfolders and it is possible to save a subfolder as a new .qti project file. Multiple project files can be appended to the current project. ×
Data Tables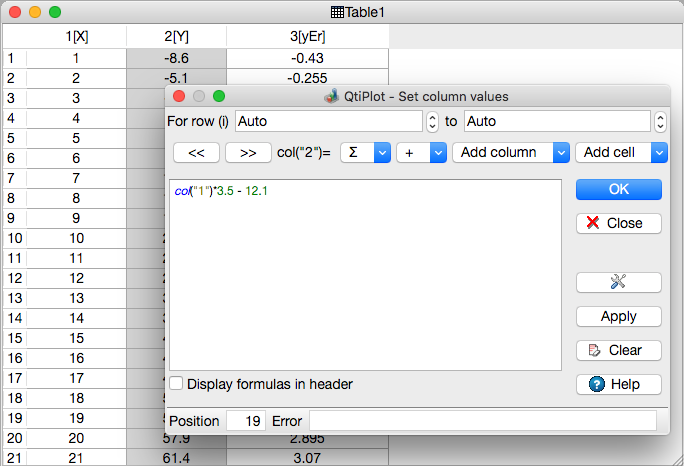
When working with data, tables are the main focus of QtiPlot. A table window is a spreadsheet which can be used to import, view, control, edit and convert data. Tables are highly customizable (all colors and font preferences can be specified via a user friendly preferences dialog) and don't have limitations in terms of number of rows or columns. Data tables handle column-logic calculations and provide easy import/export of multiple files. ×

Every column of a table has a label and can be assigned a data format: numeric, text, date or time. Various operations can be performed on table columns: fill with data, normalize, sort, view statistics and finally, generate curves from your data. It is possible to quickly preview the data in a table column by clicking on the column header. ×
Matrices
The QtiPlot matrix is a special table which is mainly used for data which depends on two variables. A matrix can be used to create 3D plots as well as 2D image and contour plots. Matrices have two functioning modes: they can display data in table form or they can display images. ×
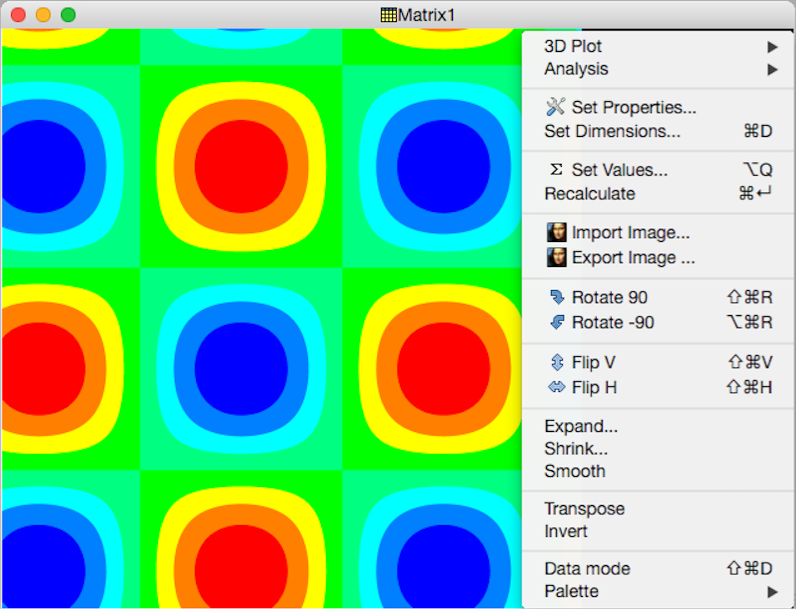
A matrix window in image mode can be used as a basic image viewer. A matrix also serves as an image editor, since it provides various useful image manipulation functions like: 90 degrees rotation, horizontal and vertical mirroring, etc... ×
Plot Windows
2D plot windows may have one or more layers, which are the main containers of a graph. Each layer contains a plotting area into which curves are placed when creating a plot. Each layer has its own geometry and graphic properties (background color, frame, etc). This example shows a 2D plot window with two layers each having different geometries. ×

All settings for individual project windows (tables, matrices and plot windows), can be saved as template files (.qwt) and restored later on for a fast editing process. ×
Notes
A note can simply be used to insert text (comments, notes, etc) into a project, but is really far more powerful than that. It can be used as a powerful mathematical calculator, for executing single commands and for writing and running Python scripts. ×

Note windows provide powerful text editor functionalities, particularly helpful when writing scripts: customizable Python syntax highlighting, line number display, find and replace text and autocompletion suggestions. The behaviour of note windows can be fully customized via a user friendly preferences dialog. ×
Project Explorer
QtiPlot provides a powerful explorer with built-in drag and drop support that helps you manage and organize the structure of your projects. The project explorer is a dockable window with two panels, one to show the folders and the other the windows in the current folder. It ensures a smooth navigation through the contents of a QtiPlot project. From the project explorer the user may perform various operations on the windows in the workspace: hiding, minimizing, closing, renaming, printing, etc... ×

The project explorer provides useful information about the windows and has a flexible structure that can be customized by the user. It also displays a picture preview when the cursor is moved over the name of a project window. The size of the preview is also customizable. ×
|