General Concepts and Terms
Several plots and all the data related to these plots can be saved in a project file. The project is therefore the main container of QtiPlot. The following screenshot gives an example of a typical session. This example shows the log panel at the top of the workspace, the project explorer at the bottom, plus a table and a plot window. Other windows are either docked or hidden.

General note on MDI style windows. QtiPlot uses a Multiple Document Interface (MDI) style for its sub-windows (for example graph and table windows, etc.). This is a convenient mechanism for placing sub-windows on a single parent window (the project window). Such collections of windows are then handled as a group when dragging or minimizing the main window. However, the behavior of maximized sub-windows is one feature of the MDI interface that may cause some confusion at first. As would be expected, sub-windows maximize to the size of the main window's workspace rather than to the size of the screen, but the default for maximized sub-windows is to have no title bar. As a consequence, there are no control boxes attached to the window, leaving the (incorrect) impression that once maximized, control boxes can no longer be used to minimize, normalize or close the sub-window. However, control boxes for a maximized sub-window are still present, they have just been moved to the extreme right hand side of the main window's menu bar. Since only one sub-window can be maximized at a time, there is no ambiguity regarding which sub-window this set of control boxes will operate upon. Finally, as a reminder of which sub-window is maximized, the Name and label of the maximized sub-window are appended to main window's title as:
"QtiPlot - ProjectName - [WindowName - WindowLabel]"
There are numerous commands available in QtiPlot. The specific subset of commands available depends on the element which is selected. Therefore, the main menu bar changes when you select a particular element of the project. Moreover, you can access the set of commands relevant to a given element by activating the context menu with the right button of the mouse when the mouse pointer is floating over the chosen element.
In a project, the containers which can be used are:
- A Table
A table is a spreadsheet like object which can be used to store the data you are entering. The table is contained in its own window (the Table Window). It can be used to perform some calculations and statistical analysis of that data. In each table, columns can be labeled as X-values or Y-values for 2D-plotting, or Z-values if you plan to build a 3D-plot.
A table can be created using the New Table command. There are then several ways to fill the table with data. If you want to read your data from an ASCII file, you can import it from the file into a table using the Import -> Import ASCII... command. You can also manually enter each value from the keyboard. Finally, you can fill the table with the results of evaluating a mathematical function using the (Set Column Values... command from the Table menu)
- An Excel Workbook
On Windows operating systems where Microsoft Excel is available you can create an Excel workbook as an OLE instance in QtiPlot workspace. Excel workbooks can be created using the New Excel command and are managed as a special type of QtiPlot child windows. They can be controlled via their context menu (right click on the window title bar to make it pop-up). All QtiPlot window functions (save, copy, duplicate, export, print, hide, close, etc...) can be reached via this menu.
- A Matrix
A matrix is a special table which is used to store the data points for surface 3D plots. It contains Z-values and doesn't include any column or row which could be designed as X-values or Y-values. Nevertheless, you can specify the X-values and the Y-values with the Set Dimensions... command from the Matrix menu.
A matrix is created using the New Matrix command. If you want to read matrix data from an ASCII file, you can import the data from the file into a table using the Import -> Import ASCII... command, and then convert this table to a matrix with the Convert to Matrix. In the same way as for tables, you can also fill a matrix with the results of evaluating a function z=(i,j) in which i and j are row and column numbers (Set Values... command from the Matrix menu)
- A Graph
A graph can contain one or several layers. A layer consists of axes, text items, graphics, and a single plotting area bounded by the axes lines. One or more curves, generated from data or functions, are placed into the plotting area to create a plot. Layers and their contained plots can be arranged in many ways to build matrix of plots. Throughout this document, the term plot window is used as a synonym for a graph.
A new layer can be added to an existing graph with the Add Layer from the Graph menu. you can also hide an existing layer or remove it, but if you remove a layer, all the objects and curves on that layer will also be deleted. You can also copy a layer from one graph to another, or copy an existing graph into another (the window will be added as a new layer - see the section on Multilayer Plots for more details).
Curves can be added to a plot in several ways. You can select data from tables or matrices to generate the curve, or, create a curve from a function of one or two variables (see sections 2D plots and 3D plots).
- A Note
This window is a text container which can simply be used to insert comments into a project, but is really far more powerful than that. It can be used as a calculator, for executing single commands, and for writing scripts.
- The Results Log Window
This window is used to store the results of all calculations which have been done. If this window is not visible, you can find it with the Project Explorer or with the Results log.
The text in the log window is also saved in the project file, so that when you load a previously saved project, the results-log panel is re-filled with the results of previous calculations.
- The Project Explorer
This window is used to list all the windows contained in a project. The Project Explorer gives quick access to all elements of a project, hidden or visible. It can be used to perform some operations on the listed windows such as hiding a window, renaming a window, etc.
A project file can include several independent projects. In this case, the containers of each project are stored in different folders.
- The Quick Help Window
This window is used to display the help pages available in the documentation for the main dialogs in QtiPlot. It can be opened using the Quick Help command from the View menu or by a click on the Help button available in any of the QtiPlot dialogs that support the quick help system.
- The Scripting Console
This window is mainly used to display error messages during the execution of Python scripts launched from note windows. It can be opened/closed using the Console command from the View menu.
Tables
When working with data, tables are the main focus of QtiPlot. Fundamentally, a table is simplified spreadsheet contained in a Window which can be used to control, edit, and convert data. Tables are also highly customizable: all colors and font preferences can be set using the Preferences... command of the View menu, and you can resize a table in terms of rows and columns using the Table menu with Rows or Columns.

Every column of a table has a label, and can be assigned a format: numeric, text, date or time. Each column can also have one of the following flags set: X, Y, Z, X-error, Y-error, label, or none (i.e., a simple column without any special flag). X flagged columns are the abscissae while Y flagged columns are the ordinates used when creating a 2D plot from data. A column must have either the X or Y flag set to be available for use in a 2D plot. The X-error and Y-error columns can be used to add error bars to a curve in a 2D plot. Flags can be changed using the Column options dialog. To reach this dialog, simply double-click on the column label or use the Column Options... command from the Table menu.
A table column is selected by left clicking on it's label. Multiple columns are selected in one of 2 ways. First, if the columns are adjacent, it is most convenient to left click on the first desired column's label and, while holding the left mouse button down, drag the mouse pointer over the labels of the column you wish to select. Second, in the case where desired columns are not adjacent, you can select additional columns by keeping the Ctrl key pressed while left clicking on the desired column's label. This also allows you to deselect specific columns. You can select all the columns of a selected table by pressing (Ctrl+A).
You can perform various operations on selected columns : fill with data, normalize, sort, view statistics and finally, generate curves from your data. All these functions can be reached by right clicking on the column label or by using the Table menu.
All other table functions: rename, duplicate, export, print, and close can be reached via the context menu (right click anywhere in the table outside the column labels area).
You can cut, copy and paste data between tables or between a table and another application (Excel, Gnumeric, etc.).
You can import single or multiple ASCII files using the Import -> Import ASCII... command from the File menu. Of course you can also export the data from a table to a text file using the Export ASCII dialog.
Excel workbooks
Excel workbooks are available only on Windows operating systems if Microsoft Excel is installed. An Excel workbook can be created using the New Excel command. You can also open an Excel file as an OLE instance in QtiPlot workspace if the Import Excel files using method defined in the General tab of the Preferences dialog is set to New Excel. Excel files can be opened through the Open Excel... command from the File menu or you can directly drag-and-drop them into the QtiPlot workspace.
When an Excel workbook is created in QtiPlot, a window type oriented menu called Excel will be available in the menu bar of the application. From this menu you can perform various operations with the data in the workbook: you can convert a data selection or entire worksheets to QtiPlot tables or export data to ASCII files. You can also convert Excel charts to QtiPlot graph windows or export them as image files. Only the image file formats supported by Excel can be chosen for this last operation.

The Excel workbook is managed as a special type of QtiPlot child window which can be controlled via its context menu (right click on the window title bar to make it pop-up). All QtiPlot window functions (save, copy, duplicate, export, print, hide, close, etc...) can be reached via this menu.

Excel specific options can be customised via the Properties dialog. The workbook can be saved as an external Excel file linked to the project or as an internal object in the QtiPlot project. If you choose to save it as an external link it is beneficial to save the Excel file in the same folder as the QtiPlot project or in a subfolder under it and then set Excel file path relative to QtiPlot project path to make them more portable.
You can cut, copy and paste data between QtiPlot tables and Excel workbooks. Please note that when copying data from Excel workbooks QtiPlot will only copy the number of digits displayed in Excel rather than the full precision values.
You can also make QtiPlot plots directly from data in an embedded Excel workbook, by selecting the data range and then opening the Plot menu and choosing a graph type, but the available graph types are largely limited especially for 3D graphs.
Matrix
The matrix is a special table which is used for data which depends on two variables. This special table can be used to create 3D plots as well as 2D image/contour plots via the Plot 3D menu and the 3D plot toolbar. One difference between a table and a matrix is that matrices may function in one of two modes: they can display data in table form or they can display an image. Therefore matrices can be used as a basic image viewer and also as an image editor, since they implement some image manipulation functions like: 90 degrees rotation, horizontal and vertical mirroring, etc.
In a matrix there is no special column nor special row for X or Y labels or values. Nevertheless, you can specify an X-scale and a Y-scale with the Set Dimensions....

The values which are stored in a matrix can be generated from a function of the form z=f(i, j, x, y) with the Set Values... command, i and j being the column and row numbers and x and y the corresponding coordinates. They can also be read directly from an ASCII file with the Import -> Import ASCII... command or from an image file.
2D Plot Window
A 2D plot window (that is, a graph), provides a container for plotting data in two dimensions. It can have one or more layers (one by default), which are the main containers of a graph. Each layer contains a plotting area onto which curves are placed when creating a plot. Each layer has its own geometry and graphic properties (background color, frame, etc). The example presented below shows a graph with two layers having different geometries.

Each layer can be activated by clicking on its corresponding button
 in the top-left corner of the window.
Some graph elements can be accessed by a double click on an element in a layer. These are:
the graph itself: this will open the Plot details dialog. You can then add new curves to the plot, or change the way the curves are plotted.
The axes or the axes labels: this will open the General Plot Options Dialog. It is used to customize the axes, the numbers and labels of the axes, and the grid.
Text items, including the legend: this will open the Text Options Dialog which allows customizing the font of the label and the frame in which it is drawn.
Arrow/Line items: this will open the Line Options Dialog.
Image items: this will open the Image Options Dialog allowing to customize the geometry and the position of the image.
A left click on a layer element selects it. You can deselect any element by pressing the Escape key. A right click on a layer element pops-up a context menu allowing quick access to its properties dialog. Last but not least, you should know that QtiPlot provides multiple selection for objects in a layer. In order to add an object to an existing selection keep the Shift key pressed and click on the element you want to add to the selection. Elements in a multiple selection can be moved and resized together with the mouse.
3D Plot Window
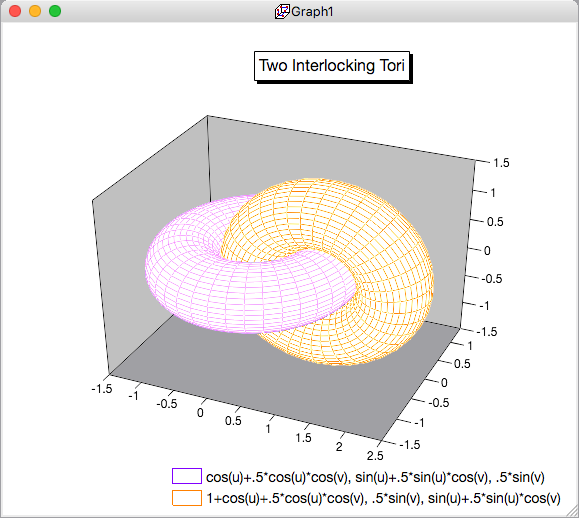
A 3D plot window provides a container for drawing three dimensional graphics. It can display multiple 3D data curves and analytical surfaces. In the example below QtiPlot draws two interlocking tori and displays their parametric equations in the legend, u and v being defined in the interval [-π, π]:
Since 3D plots are based on OpenGL, you can freely rotate, scale and shift them with the mouse. You can conveniently resize a 3D plot using the mouse wheel. Also, using the mouse wheel in combination with either the Shift, Alt or Ctrl/Cmd keys, it is possible to resize the plot along one of the three axes, as follows: pressing and holding the Alt key while rotating the wheel resizes the 3D plot along the X axis, pressing and holding the Ctrl key (Cmd key on macOS) while rotating the wheel resizes the 3D plot along the Y axis and pressing and holding the Shift key while rotating the wheel scales the plot along the Z axis.
It is possible to freely rotate a 3D plot by pressing and holding the left mouse button and moving the cursor. Also, you can freely move a 3D plot inside its window by pressing and holding the Ctrl key (Cmd key on macOS) while pressing and holding the left mouse button and moving the cursor. Releasing the mouse button and the key leaves the plot to its new position.
Using the Surface plot options dialog or the 3D Surface Toolbar, you can change all the predefined settings of a three dimensional plot: grids, scales, axes, title, legend and colors for the different elements.
Note
A note can simply be used to insert text (comments, notes, etc) into a project, but is really far more powerful than that. It can be used as a calculator, for executing single commands and for writing scripts. Evaluation of mathematical expressions and execution of code is done via a note's context menu, the Scripting menu or convenient keyboard shortcuts. For information on expression syntax, supported mathematical functions and how to write scripts, see here.

Note windows provide powerful text editor functionalities, particularly helpful when writing scripts: customizable Python syntax highlighting, line number display, find and replace text, and autocompletion suggestions for words having more than two characters. You can manually trigger autocompletion by using Ctrl+U. The colors used for syntax highlighting can be customized via the Notes tab in the Preferences dialog.
Results Log Window
This window keeps a history of all analysis which has been done in the project. It panel contains the results of all the correlations, fittings, etc.

The Project Explorer
The project explorer can be opened/closed using the Project Explorer from the View menu or by clicking on the ![]() in the file toolbar.
in the file toolbar.

It gives an overview of the structure of a project and allows the user to perform various operations on the windows (tables, graphs, and notes) in the workspace: hiding, minimizing, closing, renaming, printing, etc. These functions can be reached via the context menu, obtained by right-clicking on an item in the explorer. When the cursor is moved over a graph or matrix item name a 256x256 preview of the window is displayed.
By double-clicking on an item, the corresponding window is shown maximized in the workspace, even if it was hidden before.
From the project explorer window, different objects can be organized into folders. When selecting a folder, the default policy is that only the objects contained in it will be shown in the workspace window. You can also display all the objects in subfolders if you change this policy with the "View Windows" command to "Windows in Active Folder and Subfolders".
The Quick Help Window
This window can be opened/closed using the Quick Help command from the View menu or by a click on the Help button available in any of the QtiPlot dialogs that support the quick help system.

The main purpose of the quick help window is to display the help pages available in the QtiPlot documentation. It also implements some of the basic functionalities of a help browser: searching for user defined words in the documentation (with the help of the ![]() and
and ![]() buttons), as well as quick navigation through the recent viewing history (using the
buttons), as well as quick navigation through the recent viewing history (using the ![]() and
and ![]() buttons).
buttons).
The Scripting Console
This window can be opened/closed using the Console command from the View menu. QtiPlot opens it automatically in order to display error messages during the execution of Python scripts launched from note windows.
