Mood's Median Test Dialog
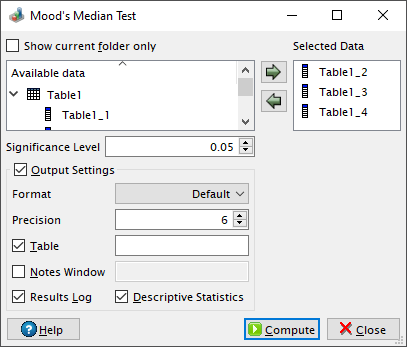
This dialog is activated by selecting the Mood's Median Test... command from the Statistics -> Nonparametric Tests -> menu. It can be used in order to test whether several samples originate from the same distribution.
QtiPlot combines the scores from the k input samples in the Selected Data box. These N values (N = n1 + n2 +...+ nk, where nj are the individual sizes of each sample) are sorted and an overall median is calculated. Afterwards QtiPlot creates a frequency table and displays the number of scores in each sample below (N1j) and above (N2j) the previousely calculated median, where R1 = N11 + N12 +...+ N1k, R2 = N21 + N22 +...+ N2k and j = 1, 2,...,k.
This test uses the Chi-Square statistic (χ2) which is calculated using the following formula: χ2 = ΣΣ(Nij-Eij)2/Eij, where Eij = Rinj/N, j = 1, 2,...,k and i can be either 1 or 2.
QtiPlot computes an approximated p-value, which is the probability of a chi-squared value of at least χ2 being observed: 1-chi2cdf(χ2, k-1), where the chi2cdf function calculates the lower tail of the cumulative distribution function for the chi-squared distribution. The null hypothesis is rejected if the approximated probability is lower than the value of the significance level.
The data sets selected in the Available data window can be added to the analysis either by pressing the left to right arrow button or by dragging and dropping them onto the right side window.